Central bank leaves policy rate unchanged, says future decisions will depend on incoming data
Tradersuite
Cut the noise.
Trade with clarity.
One research workspace for serious retail and funded traders. Study how markets have behaved historically, see the macro picture in one view, follow the headlines and the economic calendar, and review your own trading in a journal that treats it like a business.
Educational and analytical software. Not investment advice. Trading carries a high level of risk.
Make decisions from evidence, not gut feel.
Most traders piece their research together from a dozen tabs. Tradersuite brings the historical statistics, macro context, news and your own trading record into one place, so you can study the market and review your own decisions with the same data.
01
Edge Library
Historical statistical studies of how markets have behaved across futures, FX, crypto and stocks, each with its sample size and confidence interval.
02
Seasonality
Intraday, weekly and monthly seasonality views: how an instrument has tended to behave by hour, weekday, week of the year and month.
03
Macro Dashboard
Macro indicators brought together in one scored view, so the economic backdrop for each instrument is in one place.
04
News Feed
Market headlines and the economic calendar side by side, with each headline tagged by instrument and expected impact.
05
Trade Journal
Journal and analyse your own trades, sync them automatically, and track account expenses like prop fees, payouts and subscriptions.
06
AI market analyst
Ask questions about historical market data in plain English and get answers with the sample size and method shown.
M·01 Historical studies Edge Library.
Edge Library.
How markets have behaved, with the statistics shown.
A searchable library of historical statistical studies of recurring market behaviour, from candle patterns to session ranges. Open any study to see how often each outcome has occurred for your instrument, session and lookback, with the sample size and confidence interval beside every number.
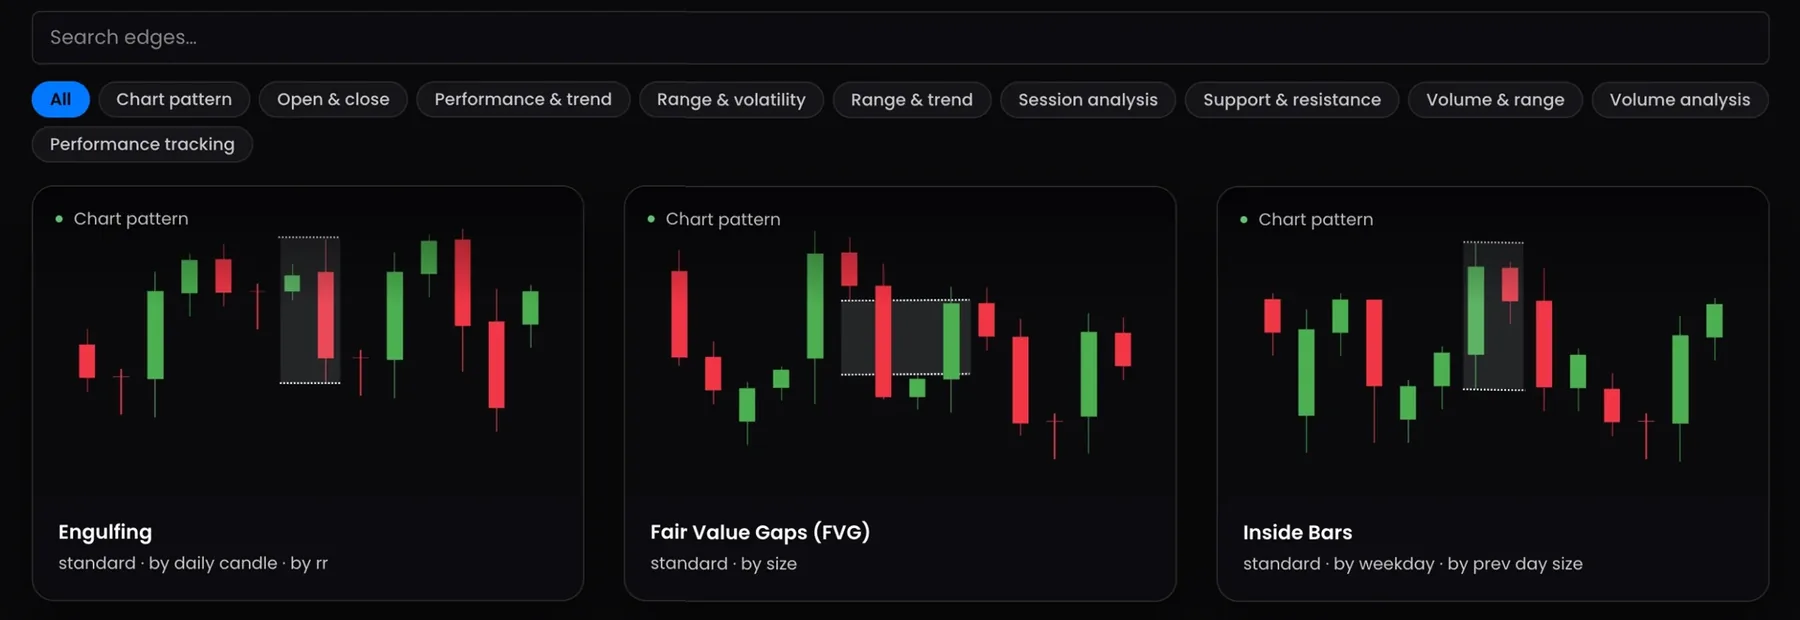
Historical data for educational purposes only. Past performance is not indicative of future results.
- 01 Sample size on every figure. Each study shows how many occurrences it is based on, so a figure from 8 sessions never looks the same as one from 800.
- 02 Confidence intervals. Every percentage carries a 95% confidence interval, so you can see how much uncertainty sits behind it.
- 03 Recent versus long-run. Studies flag when recent behaviour has drifted away from the long-run historical rate.
- 04 Filter to your exact question. Instrument, session, timeframe, lookback period and variant: narrow a study down to the slice you care about.
- 05 Multi-asset coverage. Futures, FX, crypto and stocks in one library, with one consistent way of presenting the statistics.
- 06 Built for study, not signals. The library describes what has happened historically. It does not tell you what to trade.
M·02 Seasonality Seasonality.
Seasonality.
Intraday, weekly and monthly views.
See how an instrument has historically behaved by hour, weekday, week of the year and month. Seasonality is context for your research: it shows tendencies in past data, not what will happen next.
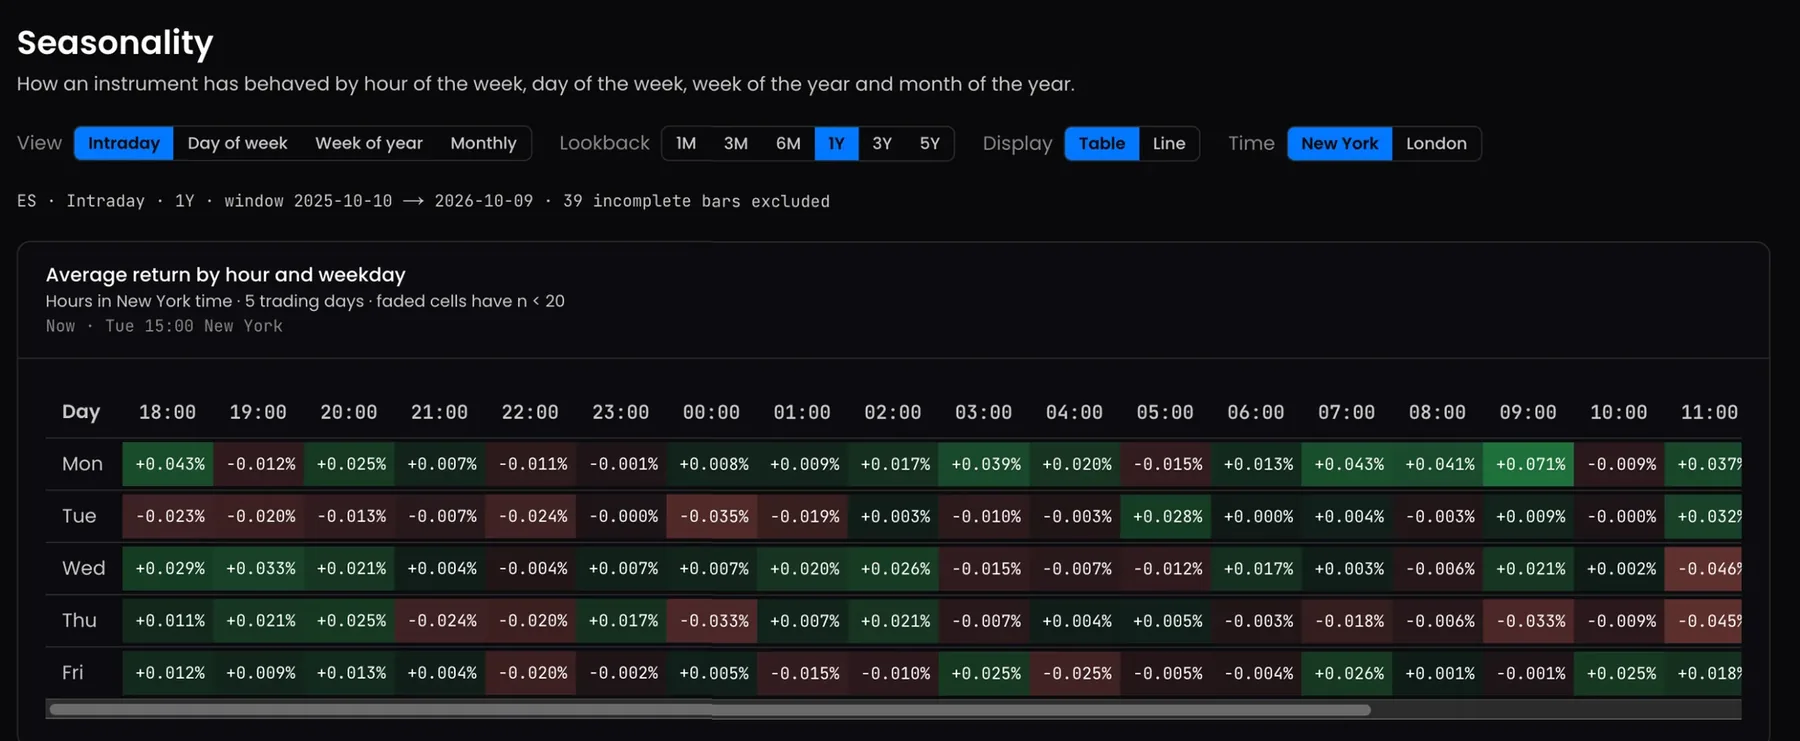
Historical data for educational purposes only. Past performance is not indicative of future results.
- 01 Intraday. Average historical behaviour by hour of the day and day of the week, in New York or London time.
- 02 Weekly. How an instrument has tended to behave on each day of the week, and by week of the year.
- 03 Monthly. Month-of-year tendencies over the lookback you choose.
- 04 Lookbacks from one month to five years. Compare recent seasonality with longer histories side by side.
- 05 Table or line view. Scan a heatmap of averages or switch to a line chart.
- 06 Thin data is marked. Cells with small samples are faded so they are not mistaken for a strong tendency.
M·03 Macro Macro Dashboard.
Macro Dashboard.
The economic backdrop in one scored view.
Growth, inflation, employment, sentiment and positioning data brought together and scored for each instrument, so you can see the macro backdrop at a glance instead of assembling it yourself.
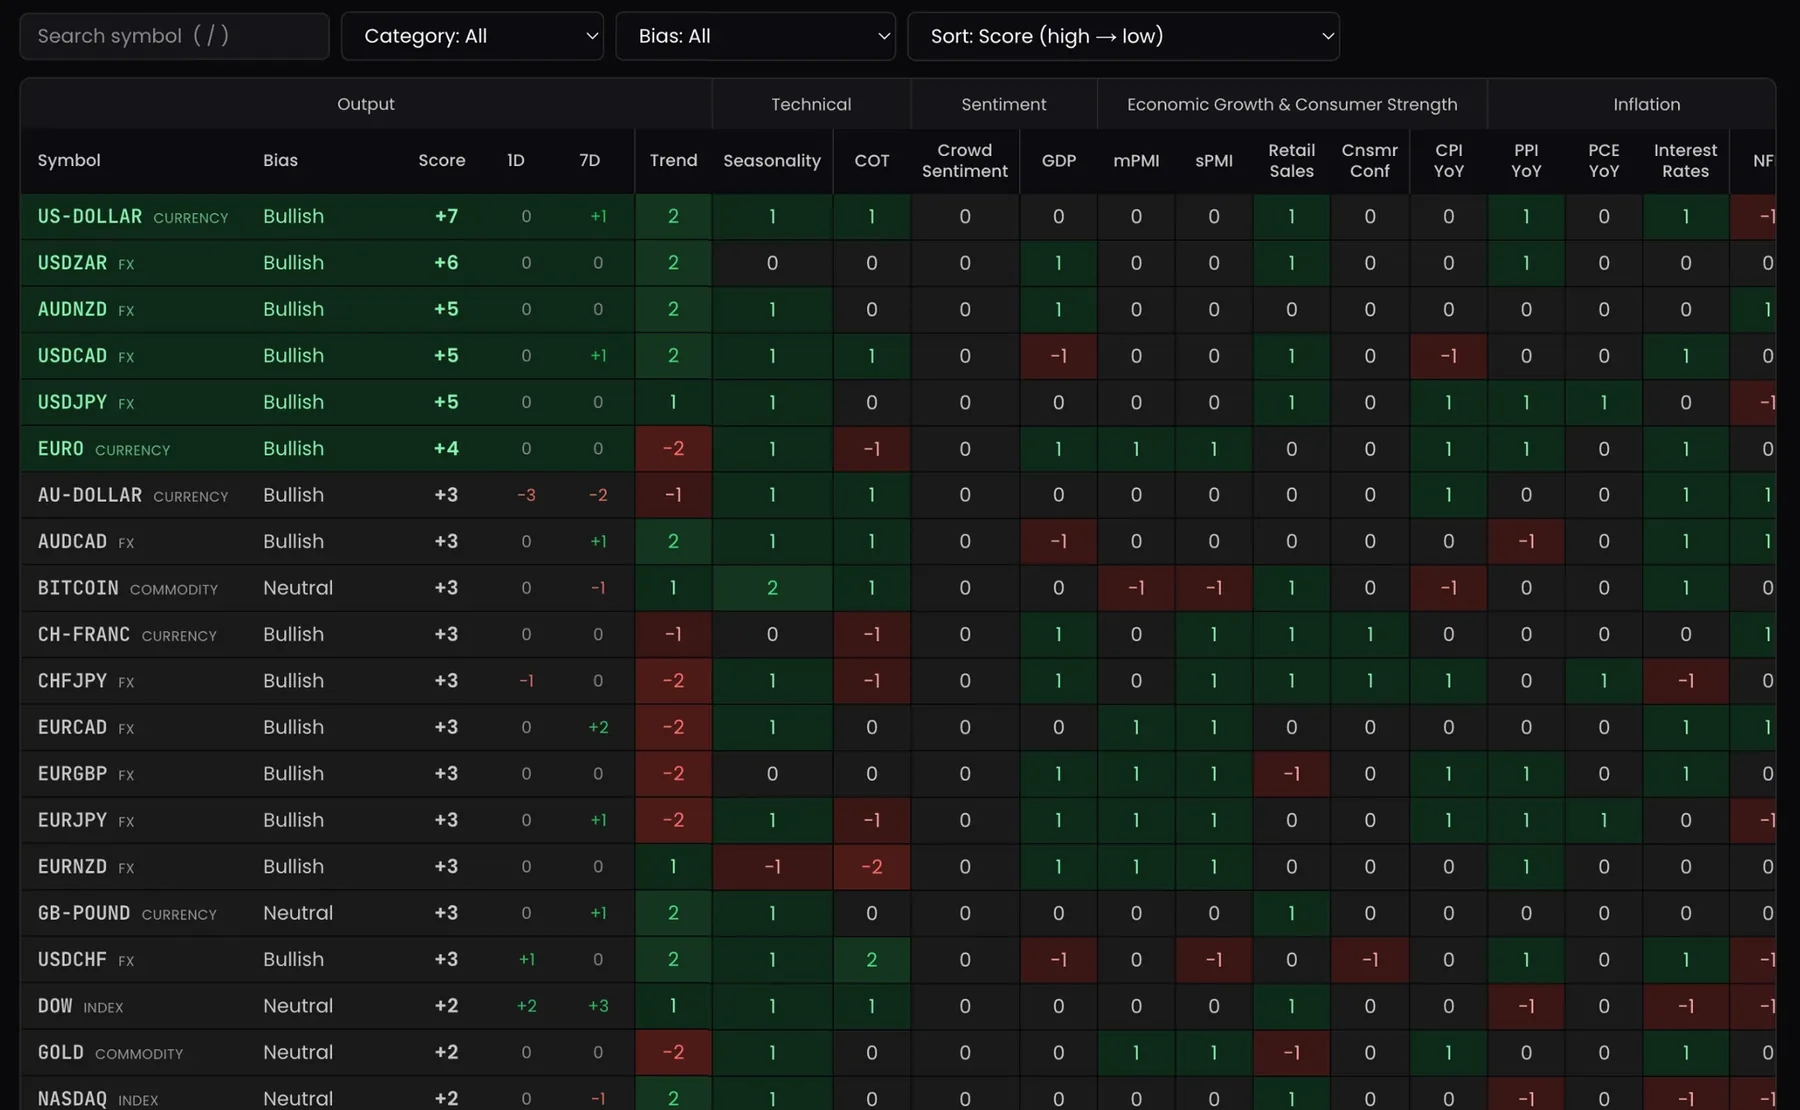
Historical data for educational purposes only. Past performance is not indicative of future results.
- 01 One scored view. Technical, sentiment, growth, inflation and employment indicators combined into a single score per instrument.
- 02 See what drives each score. Every component is shown column by column, so nothing is hidden behind a single number.
- 03 Positioning data. Commitments of Traders positioning with week-on-week changes and long historical charts.
- 04 Economic heatmap. Actual versus forecast versus previous for the major releases, with the size of each surprise colour-coded.
- 05 Central banks. Current policy rates and decision history for the major central banks.
- 06 Context, not calls. Scores summarise data. They are not a recommendation to buy or sell anything.
M·04 Headlines & calendar News Feed.
News Feed.
Market headlines and the economic calendar.
Follow the market headlines and the economic calendar in one place. Each headline is tagged by the instruments it relates to and its expected impact, with a link to the original source.
Headlines
Weekly crude inventories show a larger draw than forecast
UK services activity expands for a third straight month
Illustrative example. Headlines and calendar entries are placeholders, not real news.
- 01 Headlines and calendar together. Market headlines next to the economic calendar, so scheduled releases and the news around them sit in one view.
- 02 Impact tags. Each headline is tagged high, medium or low impact, and with the instruments it relates to.
- 03 Calendar with forecasts. Upcoming releases with time, expected impact, forecast and previous figures.
- 04 Historical context. See how instruments have historically moved around similar releases, drawn from the same data as the Edge Library.
- 05 Link to the source. Every item links back to the original headline, so you can read it as written.
- 06 Information, not instructions. Tags describe the news. They do not tell you to buy or sell.
M·05 Journal & expenses Trade Journal.
Trade Journal.
Review your trading. Count the costs.
Keeping a journal by hand rarely lasts. Tradersuite syncs your trades automatically and turns them into analytics you can review: what you traded, when, and how it went. Account Expenses sits alongside it, so prop fees, subscriptions and payouts are tracked like the business costs they are.
P&L calendar · demo monthSynced trades
Mon
Tue
Wed
Thu
Fri
Sat
Sun
1+120
2−85
3+40
6−150
7+60
8+95
9−30
10+75
13−110
14+20
15+130
16−60
17+45
20+85
21−95
22+30
23−40
24+110
Trades
38
Winning days
11 / 18
Largest loss day
−150
Avg day
+13
Account expenses · demo monthLedger
| Item | Amount |
|---|---|
| Evaluation fees (2 accounts) | −$300 |
| Reset fee | −$80 |
| Platform & data subscriptions | −$129 |
| Payout received | +$400 |
| Net cost of trading this month | −$109 |
Demo data for illustration only. It does not represent any real account or a typical result.
- 01 Automatic trade sync. Connect a supported trading platform and trades arrive in your journal as they close. CSV import works for everything else.
- 02 Analytics on your own trading. P&L calendar, equity curve, win/loss and streak tracking, broken down by instrument, session and setup.
- 03 Tag trades to studies. Link a trade to an Edge Library study and compare how you traded it with how that behaviour has played out historically.
- 04 Account Expenses. Track prop evaluation fees, resets, platform and data subscriptions, and payouts in one ledger.
- 05 Treat trading like a business. See your trading results net of what it costs you to trade, month by month.
- 06 Review, not recommendations. The journal describes your own past trading. It does not tell you what to trade next.
M·06 AI market analyst AI market analyst.
AI market analyst.
Ask the historical data a question.
Instead of clicking through filters, ask. The AI market analyst is a conversational assistant over Tradersuite's historical market data. It runs read-only queries, then replies with the result, the sample size and the method it used.
You
“On Tuesdays over the last seven years, how often has ES filled its opening gap during the session?”
AI market analyst
In the historical sample, the answer gives the share of Tuesdays with an opening gap where the gap was filled during the session, the number of sessions it is based on, and the 95% confidence interval. It describes past sessions only and says nothing about what the next session will do.
▸ gap_fill_rate(ticker="ES", lookback="7y", day_of_week="Tue")
Historical rate
··%
Sample
n = ···
95% CI
··–··%
Data
Historical
Illustrative example of the answer format; no real results are shown. Historical data for educational purposes only. Past performance is not indicative of future results.
- 01 Plain-English questions. Ask about historical price behaviour the way you would ask a colleague, and refine with follow-ups.
- 02 The method is shown. Each answer shows the query that produced it, with its parameters, so you can check how a number was calculated.
- 03 Statistics come with context. Sample size and confidence interval sit next to every figure.
- 04 Read-only and bounded. The analyst answers from a fixed set of read-only queries over historical data. It does not write or change anything.
- 05 About the past, not the future. It describes what has happened historically. It does not forecast prices or tell you what to trade.
- 06 Follow-ups keep context. "Now only Tuesdays", "compare with last year": the conversation carries through.
One workspace instead of a dozen tabs.
01
Statistically honest
Every figure carries its sample size and a confidence interval, and is clearly labelled as historical. No headline percentages built on a handful of observations.
02
One data layer
The studies, seasonality, macro scores, news context, journal and AI analyst all read from the same historical data, so the numbers agree with each other.
03
Your own trading in context
Review your trades and costs next to the same historical studies you research with, and learn from your own record.
Join the waitlist for early access.
Tradersuite is not open to the public yet. Leave your email and we will let you know when early access opens.
You're on the list.
We'll email you when early access opens.
Already have access? Sign in.
Questions people ask first.
What is Tradersuite?
Tradersuite is an educational and analytical software tool for traders. It brings together historical market statistics (the Edge Library and Seasonality), a Macro Dashboard, a News Feed with the economic calendar, a Trade Journal with Account Expenses, and an AI market analyst over historical data.
Who is it for?
Serious retail traders and funded or prop firm traders who want to research markets with data and review their own trading in a structured way.
Does Tradersuite give trading signals or advice?
No. Tradersuite shows historical statistics and helps you review your own trading. It does not give investment advice, recommendations or signals, it does not tell you what to trade, and it does not manage money. You are solely responsible for your own trading decisions.
What does the AI market analyst do?
It answers plain-English questions about historical market data by running read-only queries, and shows the sample size and method alongside each answer. It does not predict prices or suggest trades.
How should I read the statistics?
Every figure is historical. Each comes with its sample size and a confidence interval so you can judge how much weight it can bear. Past performance is not indicative of future results.
How much will it cost?
Pricing has not been decided yet. Join the waitlist and we will share details before early access opens.
When can I use it?
Tradersuite is not open to the public yet. Join the waitlist and we will email you when early access opens.
Which trading platforms will the journal sync with?
We will list supported platforms here as each connection goes live. CSV import will be available for any platform that is not directly supported.
How do I get in touch?
Email hello@tradersuite.io.